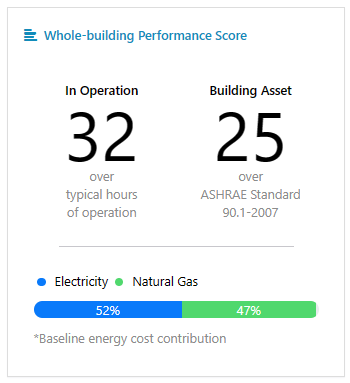
Energy use intensity (EUI) tells you how much energy a building uses per square foot. It doesn't tell you why. A high EUI can come from long operating hours, from an old envelope and inefficient equipment, or from both, and the fix is different in each case. InverseAudit's benchmarking separates the two, from the building's calibrated model, and the results are now part of the audit report.
Three scores from one calibrated model
- ENERGY STAR score (1 to 100): how the building compares with similar buildings nationwide, calculated through ENERGY STAR Portfolio Manager. 50 is the median; 75 or higher qualifies for certification. Not every building type has one.
- Operational score: compares the building with the same building run on the typical schedules and setpoints for its type. A building that runs longer hours than typical scores below 50.
- Asset score: compares the building with the same building built to the energy code you choose, on its own schedules. Like a car's MPG rating, it reflects the building itself: insulation, windows, lighting power and equipment efficiencies.
Both the operational and asset scores use the same scale as the ENERGY STAR score, where 50 is the reference: using 20% less energy than the reference scores 60, and 20% more scores 40. All the models run with the same typical-year weather, so the weather never moves the scores. If the operational score is the low one, start with operations; if the asset score is, start with the building.
End-use benchmarking
The same comparison runs end use by end use: heating, cooling, fans, lighting, plug loads, pumps and water heating. For each, the gap to the typical-operation scenario and to the code-compliant scenario shows where the excess energy goes, and whether it's an operational problem or an asset problem. The Benchmarking page also compares the building's energy cost with a code-compliant version of itself, for the energy code you choose.
New: benchmarking in the audit report
The InverseAudit report now includes a Benchmarking section right after the Executive summary: the ENERGY STAR score, the operational and asset scores, the energy cost against the energy code and the end-use benchmarking, with the analyses written on the Benchmarking page. It can also be downloaded on its own from the report's Download PDF menu. The ASHRAE Level 1 and Level 2 reports keep to the standard's structure and leave it out.
New: watch the calibration as it runs
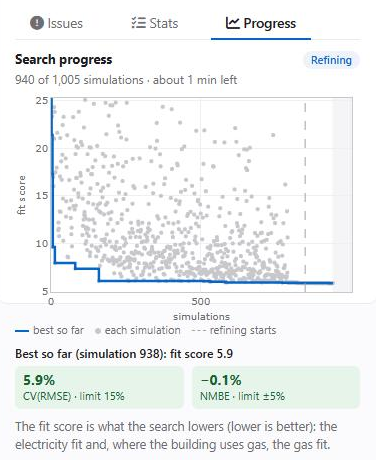
Every score above depends on how well the model matches the building's meter data. The calibration's new Progress tab shows its search live: whether it's searching widely or refining the best match, how many simulations have run and about how long is left, each simulation's fit as a dot on the chart, and the best match so far, with its CV(RMSE) and NMBE against the ASHRAE Guideline 14 limits. Choose a calibration length to fit the job: Quick (about 3 minutes), Standard (about 20 minutes, recommended) or Thorough (about 40 minutes).
Related reading