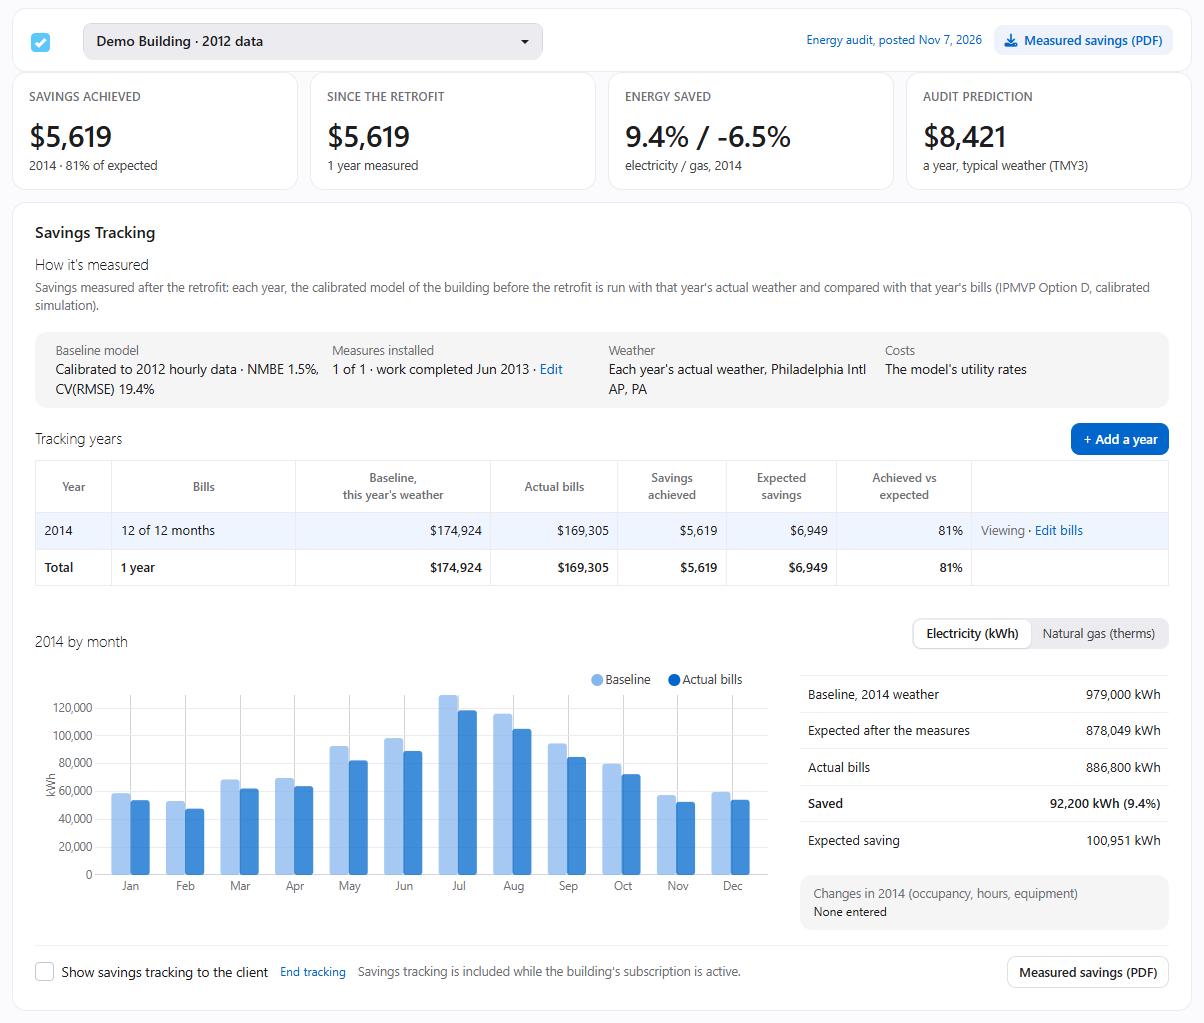
An energy audit predicts savings. Building owners, lenders and program administrators want to know whether those savings showed up. InverseAudit's savings tracking answers that question: after the measures are installed, it measures what they actually save, year by year, against the same calibrated model the audit was built on.
How the savings are measured
Savings tracking follows IPMVP Option D, calibrated simulation. For each tracking year, InverseAudit runs the building's calibrated model twice, both times with that year's actual weather:
- Baseline: the building as it was before the retrofit. What it would have used without the measures.
- Expected: the same model with the measures that were installed. What it should use with them.
Both are compared with the year's bills, month by month. Savings achieved is the baseline minus the actual bills; expected savings is the baseline minus the expected model; and achieved vs expected shows how the measures performed against the prediction.
Running the baseline in the year's own weather is what makes the comparison fair. A hot summer raises the baseline's cooling too, so it doesn't hide the savings, and a mild winter doesn't create savings the measures didn't make.
Before the measures are installed
Once the audit is posted, the Savings Tracking page shows what the selected measures would have saved with the last 12 months' actual weather, updated every month. Reminder emails tell the client's team what they're missing, quarterly by default, and stop once tracking starts.
Entering the bills
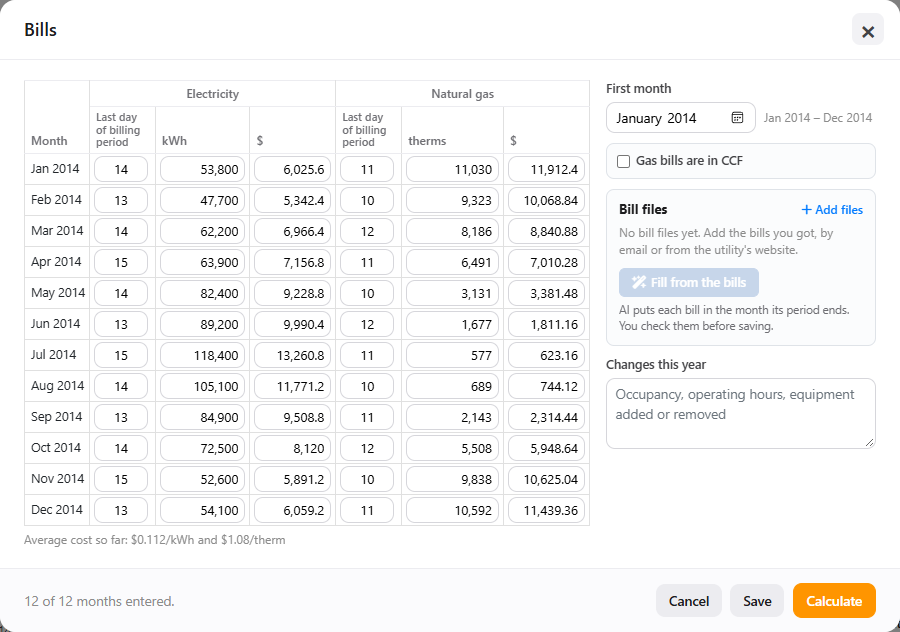
- Billing periods: enter each bill's last day of billing period and the model runs over the bills' own periods, so each month's model use and bill cover the same days.
- Fill from the bills with AI: add the bill files (PDF, JPG or PNG) and AI fills in each month's use and cost, marking what it filled for you to check.
- Gas in CCF: enter gas as it appears on the bills, with the therms per CCF factor.
- Changes this year: note anything else that changed, such as occupancy, hours or equipment, so whoever reads the results knows.
Savings so far
You don't have to wait for the year to end. The months that already have bills can be measured as a preliminary result, and update by themselves each month. They aren't scaled up to a year, since gas savings come mostly in winter and electricity savings more in summer.
Pricing the savings fairly
With monthly bills, every kWh and therm is priced at the model's average cost per unit, so the savings measure energy, not rate changes. If a year's bills average more than 2% more or less per unit than the model, the page says so, and one click reprices the measured years at what the building actually pays.
Sharing the results
Show savings tracking to the client and they see the overview and the measured savings on their own read-only page. Email the client's team when a year is measured, or download the measured savings as a PDF.
Savings tracking is included while the building's InverseAudit subscription is active.
Related reading